

Basketball Analytics: 4 Proven Factors for a Remarkable State Run





Basketball Analytics isn’t just for the NBA; as a high school math teacher, it is the bridge between my classroom and the hardwood. My daily mission is twofold: building meaningful connections with my students and driving their curiosity to understand the “why” behind the numbers. I’ve always loved incorporating data into my own life to improve efficiency—from tracking my sleep patterns to analyzing my greens in regulation on the golf course. Naturally, this analytical mindset translates to how I run my basketball program.
My introduction to analytics started in high school while watching my favorite player, Steve Nash. Coach Mike D’Antoni’s “7 Seconds or Less” offense revolutionized the game by hunting the most efficient shot possible before the defense could set. Later, I discovered the book Midrange Theory, which introduced me to the concept of Points Per Possession (PPP). The math was simple but profound: a 3-pointer hit at a 30% rate (0.9 PPP) is more valuable than a 2-pointer hit at 42% (0.84 PPP).
I began applying the same “rule of curiosity” I teach my students to my own coaching development. This path eventually led me to Nate Oats. I felt an immediate connection to Coach Oats because of our shared background as former high school math teachers and basketball coaches. He exemplifies the analytical approach, setting his principles of play based on efficiency within the Four Factors of Basketball.
But what are these factors, and how did I—a varsity girls basketball coach—use them to guide my program through a state tournament run after taking over a “traditional” system?
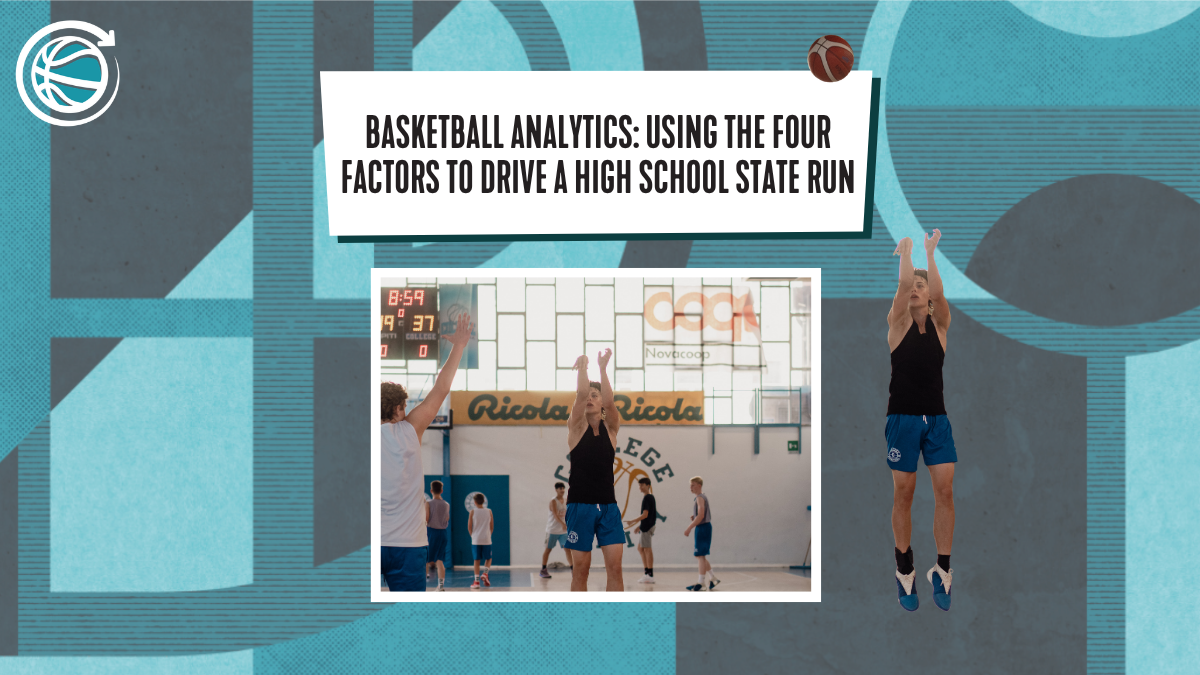
Alt-text: High school coach planning a game strategy using basketball analytics and the four factors.
1. Effective Field Goal Percentage (eFG%) in Basketball Analytics
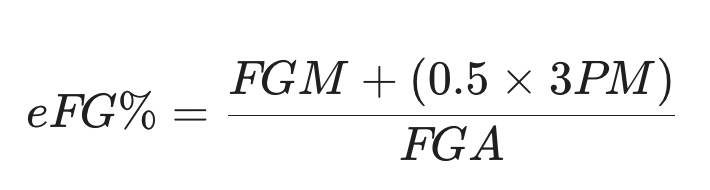
Traditional field goal percentage treats all shots as equal. eFG% adjusts for the fact that a three-point shot is worth 1.5 times more than a two-point shot. This is a cornerstone of modern basketball analytics.
The Formula:
We used this stat to shape our shot selection. When introducing our conceptual offense, we categorized shots using a “Medal System” to identify the most efficient outcomes:
- Gold Medal: 1v1 at the rim with an advantage, or free throws.
- Silver Medal: Inside-out, spot-up 3-pointers. (We found that “paint touches” or “skips” led to a significantly higher percentage).
- Bronze Medal: 3-pointers off the dribble, “one-more” extra passes, or neutral paint pulls.
To get these shots, we played with “lag-free” pace, using a two-sided break to create “dominos” (disadvantaged defenders). Defensively, we prioritized protecting the “smile” (the area directly in front of the rim) and forced opponents into contested, off-the-dribble mid-range jumpers.
2. Turnover Percentage (TO%): Defensive Basketball Analytics
This statistic measures how often a team ends a possession without even getting a shot off. We used this to drive our defensive identity.
We aimed for a 30% turnover rate, meaning 3 out of every 10 opponent possessions ended in a turnover. We found that our PPP was significantly higher in transition off turnovers (2v1s, 3v2s, and 1v0 layups). To achieve this, we full-court pressed man-to-man for all 36 minutes, utilizing a 10-player rotation. By the second half, opponents would tire out, leading to “Kill Shots” (three consecutive stops).
Offensively, we used this stat to identify where our own mistakes were happening—whether in the “green” transition phase or during specific PNR (pick-and-roll) triggers—allowing us to create specific coverage solutions in practice.
3. Offensive Rebounding Percentage (ORB%) and Confidence
This stat tracks the percentage of available offensive rebounds a team secures. We aimed for 40%. In the realm of basketball analytics, second-chance opportunities are a high-value metric that correlates directly to winning.
For U18 girls, confidence is often the biggest hurdle. We framed offensive rebounding as a “Protection Plan.” We gave every player a “green light” to let it fly from deep, reassuring them that even if they missed, we had a plan to get the ball back 4 out of 10 times.
Because we lacked height (no player over 5’10”), we used a “tagging up” system. We noticed that opponents struggled to rebound long misses from 3-point shots because they were often sprinting back to stop our transition pace. These long rebounds gave our smaller, quicker players a better chance to win the ball at the “nail” (free throw line) rather than fighting taller players under the rim.
4. Free Throw Rate (FT Rate) as a Performance Indicator
FT Rate measures how often a team gets to the line relative to their field goal attempts.
Offensively, this was our metric for “hunting paint.” If our FT Rate was high, it meant we were successfully attacking the rim and earning “Gold Medal” opportunities. Defensively, the challenge was maintaining our aggressive full-court pressure without fouling. We coached our players to move away from “shuffling” their feet to “cross-stepping and sprinting” with the ball handler, allowing them to stay in front without reaching.
Final Thoughts on Modern Basketball Analytics
Data-driven decisions allowed our team to play with a clear identity and unwavering confidence. By focusing on these four factors, we turned the “why” of math into the “how” of winning.
There is certainly a case for more discussion on how basketball analytics can drive a program that prioritizes Principles of Play and the Constraints-Led Approach (CLA). For more practical insights into transforming your team, stay tuned for our next breakdown on ecological dynamics on the court.




Basketball Analytics isn’t just for the NBA; as a high school math teacher, it is the bridge between my classroom and the hardwood. My daily mission is twofold: building meaningful connections with my students and driving their curiosity to understand the “why” behind the numbers. I’ve always loved incorporating data into my own life to improve efficiency—from tracking my sleep patterns to analyzing my greens in regulation on the golf course. Naturally, this analytical mindset translates to how I run my basketball program.
My introduction to analytics started in high school while watching my favorite player, Steve Nash. Coach Mike D’Antoni’s “7 Seconds or Less” offense revolutionized the game by hunting the most efficient shot possible before the defense could set. Later, I discovered the book Midrange Theory, which introduced me to the concept of Points Per Possession (PPP). The math was simple but profound: a 3-pointer hit at a 30% rate (0.9 PPP) is more valuable than a 2-pointer hit at 42% (0.84 PPP).
I began applying the same “rule of curiosity” I teach my students to my own coaching development. This path eventually led me to Nate Oats. I felt an immediate connection to Coach Oats because of our shared background as former high school math teachers and basketball coaches. He exemplifies the analytical approach, setting his principles of play based on efficiency within the Four Factors of Basketball.
But what are these factors, and how did I—a varsity girls basketball coach—use them to guide my program through a state tournament run after taking over a “traditional” system?
Alt-text: High school coach planning a game strategy using basketball analytics and the four factors.
1. Effective Field Goal Percentage (eFG%) in Basketball Analytics
Traditional field goal percentage treats all shots as equal. eFG% adjusts for the fact that a three-point shot is worth 1.5 times more than a two-point shot. This is a cornerstone of modern basketball analytics.
The Formula:
We used this stat to shape our shot selection. When introducing our conceptual offense, we categorized shots using a “Medal System” to identify the most efficient outcomes:
- Gold Medal: 1v1 at the rim with an advantage, or free throws.
- Silver Medal: Inside-out, spot-up 3-pointers. (We found that “paint touches” or “skips” led to a significantly higher percentage).
- Bronze Medal: 3-pointers off the dribble, “one-more” extra passes, or neutral paint pulls.
To get these shots, we played with “lag-free” pace, using a two-sided break to create “dominos” (disadvantaged defenders). Defensively, we prioritized protecting the “smile” (the area directly in front of the rim) and forced opponents into contested, off-the-dribble mid-range jumpers.
2. Turnover Percentage (TO%): Defensive Basketball Analytics
This statistic measures how often a team ends a possession without even getting a shot off. We used this to drive our defensive identity.
We aimed for a 30% turnover rate, meaning 3 out of every 10 opponent possessions ended in a turnover. We found that our PPP was significantly higher in transition off turnovers (2v1s, 3v2s, and 1v0 layups). To achieve this, we full-court pressed man-to-man for all 36 minutes, utilizing a 10-player rotation. By the second half, opponents would tire out, leading to “Kill Shots” (three consecutive stops).
Offensively, we used this stat to identify where our own mistakes were happening—whether in the “green” transition phase or during specific PNR (pick-and-roll) triggers—allowing us to create specific coverage solutions in practice.
3. Offensive Rebounding Percentage (ORB%) and Confidence
This stat tracks the percentage of available offensive rebounds a team secures. We aimed for 40%. In the realm of basketball analytics, second-chance opportunities are a high-value metric that correlates directly to winning.
For U18 girls, confidence is often the biggest hurdle. We framed offensive rebounding as a “Protection Plan.” We gave every player a “green light” to let it fly from deep, reassuring them that even if they missed, we had a plan to get the ball back 4 out of 10 times.
Because we lacked height (no player over 5’10”), we used a “tagging up” system. We noticed that opponents struggled to rebound long misses from 3-point shots because they were often sprinting back to stop our transition pace. These long rebounds gave our smaller, quicker players a better chance to win the ball at the “nail” (free throw line) rather than fighting taller players under the rim.
4. Free Throw Rate (FT Rate) as a Performance Indicator
FT Rate measures how often a team gets to the line relative to their field goal attempts.
Offensively, this was our metric for “hunting paint.” If our FT Rate was high, it meant we were successfully attacking the rim and earning “Gold Medal” opportunities. Defensively, the challenge was maintaining our aggressive full-court pressure without fouling. We coached our players to move away from “shuffling” their feet to “cross-stepping and sprinting” with the ball handler, allowing them to stay in front without reaching.
Final Thoughts on Modern Basketball Analytics
Data-driven decisions allowed our team to play with a clear identity and unwavering confidence. By focusing on these four factors, we turned the “why” of math into the “how” of winning.
There is certainly a case for more discussion on how basketball analytics can drive a program that prioritizes Principles of Play and the Constraints-Led Approach (CLA). For more practical insights into transforming your team, stay tuned for our next breakdown on ecological dynamics on the court.




check what's trending

What is ecological dynamics and how is it connected to a constraints-led approach?
Dec 8, 2025
George Vaz

Are you searching for the best small sided games (SSGs) to improve your basketball practices? Want to replace boring, low-transfer drills with competitive games that actually develop player decision-making and in-game skills?
In this post, I’m sharing my top 5 favorite small-sided basketball games—designed to teach core concepts like closeouts, pick-and-roll, advantage creation, and transition offense and defense. These basketball SSGs are intense, purposeful, and built around real-game actions.
Whether you're coaching youth basketball, high school, or pros, these top small sided games will make your sessions more effective, more engaging, and more fun—for both players and coaches.
Let’s break down each game and how it can transform your practices.
Aug 4, 2025
George Vaz

Whether you’re coaching in the NBA, EuroLeague, or youth basketball, one thing remains universally true: the worst transition offense is still more efficient than the best half-court offense. Yet, many teams still struggle to fully capitalize on transition opportunities, often opting to slow down the game instead of pushing the pace. The question is, why? By running more intentionally, teams can create easier scoring opportunities. So why do some teams hesitate?
Apr 7, 2025
George Vaz
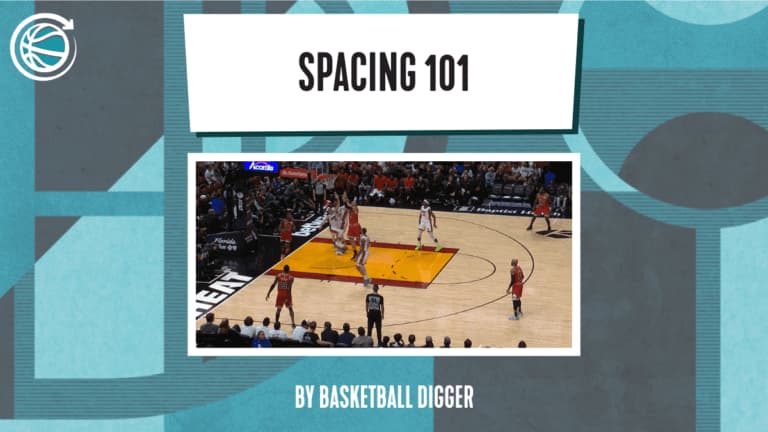
Spacing has changed the game. NBA offenses today look nothing like they did in the ’90s—more threes, better efficiency, and smarter shot selection. But why? The key lies in how teams use space to create and capitalize on advantages.
Mar 31, 2025
Simon Caret
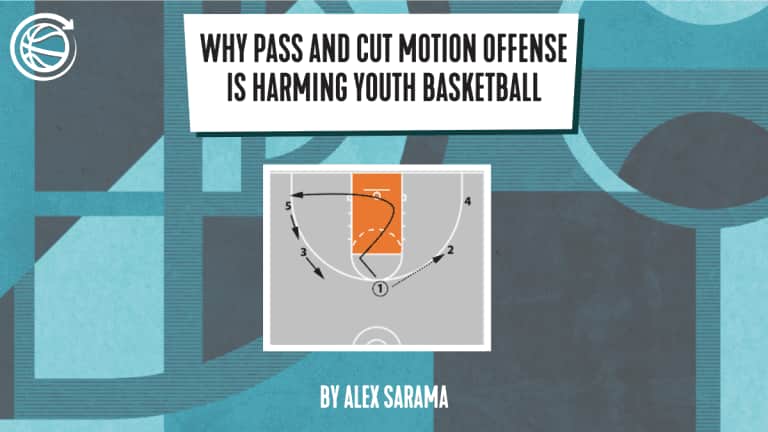
This article breaks down why pass and cut motion offense limits youth player development, and explores better ways to teach spacing, decision-making, and offensive creativity.
May 1, 2024
Alex Sarama
Approaches within the basketball industry are predominantly based upon experiential knowledge and traditions.


